Hand2Note Popup Editor: Creating a Professional Popup
Last time, we completed the “getting familiar” stage: we learned how to navigate the popup editor interface and built a simple popup.
Today the goal is more ambitious — creating a complex, multi-level tool. We’ll go over how to add tabs to a popup, integrate postflop hand strength histograms, use preflop diagrams, and configure detailed stats for deeper game analysis.
What will the final popup look like?
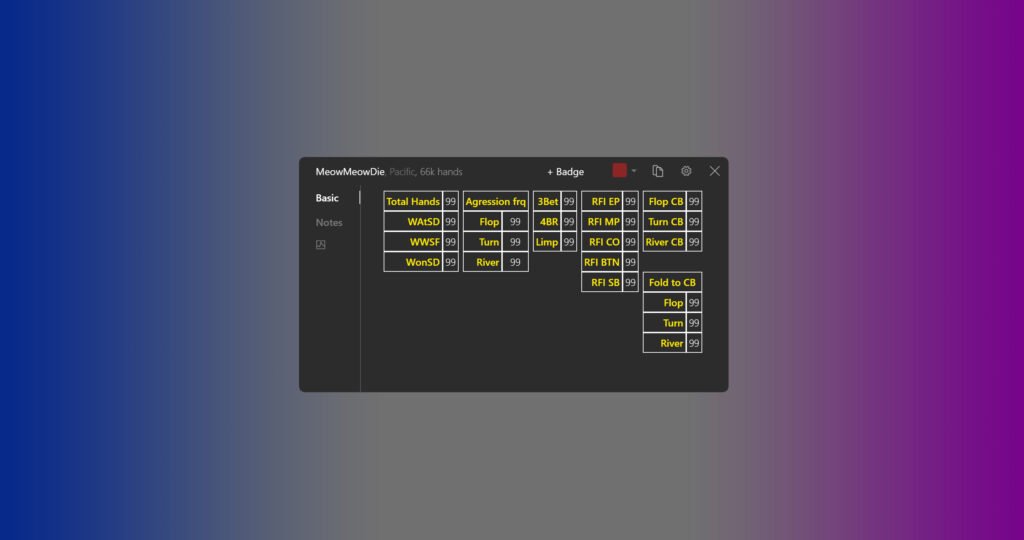
Previously, while working with the popup editor, we created a popup that looks like this:
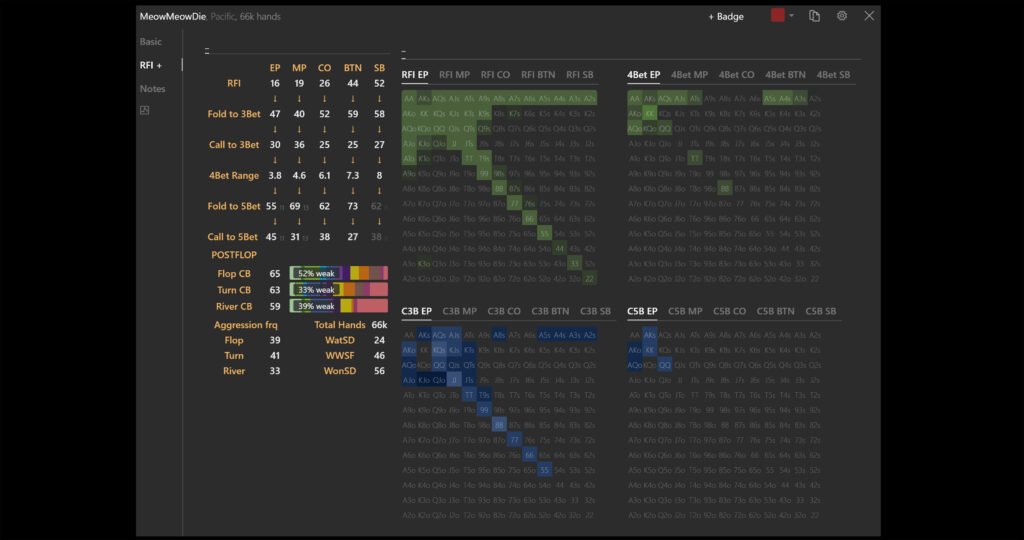
Now it’s time to upgrade it: add nested tabs, graphical range displays, and other elements that turn basic stats into a full-featured analytical tool:
Creating a new popup tab
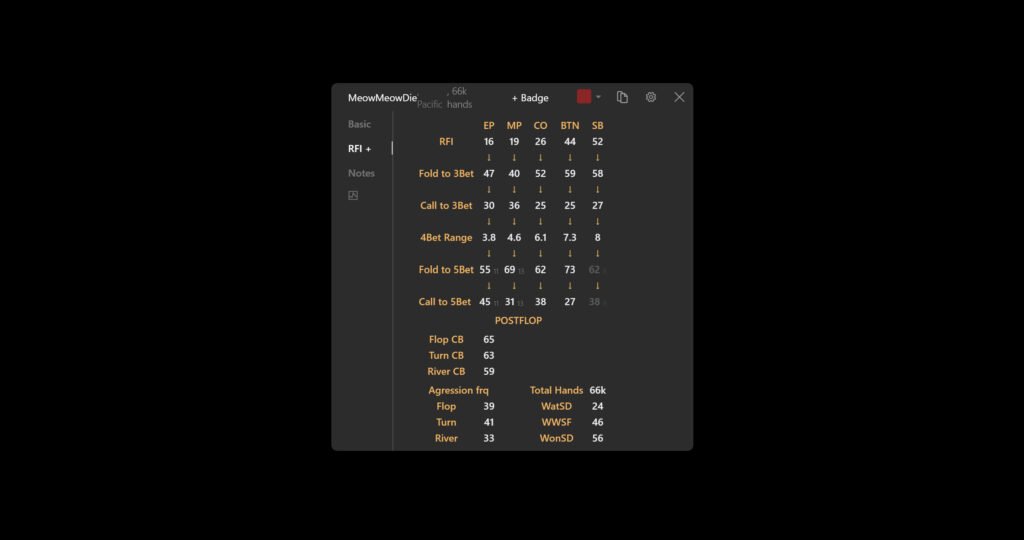
Using the methods described in the article “Hand2Note Popup Editor: Creating a Simple Popup“, create a new tab in the popup, apply a popup panel to it, and fill it with the necessary stats and labels. It’s worth noting that for this example we created the required stats in advance. An example of the newly created “RFI+” tab:
Adding postflop histograms
Let’s start by adding postflop histograms next to the stats that reflect a player’s continuation bet frequency.
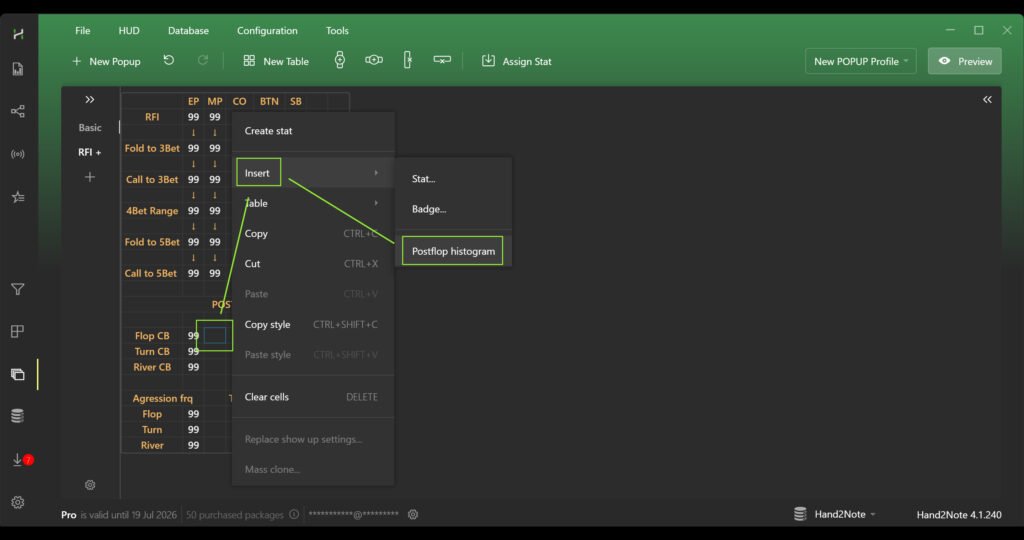
To add a histogram, right-click on the desired cell. Then, in the menu that appears, hover over “Insert” and select “Postflop histogram” from the dropdown list.
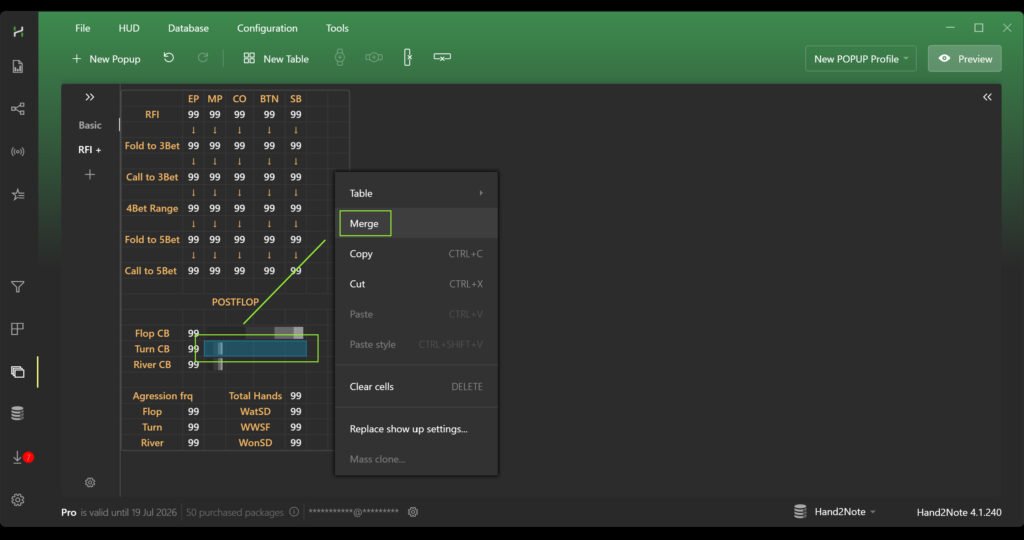
To stretch the postflop histogram across the required number of cells, select them, right-click, and choose “Merge”. Important rule: when merging, the cell containing the histogram must always be in the top-left corner of the selected area.
Now you need to assign the stat that each histogram will display.
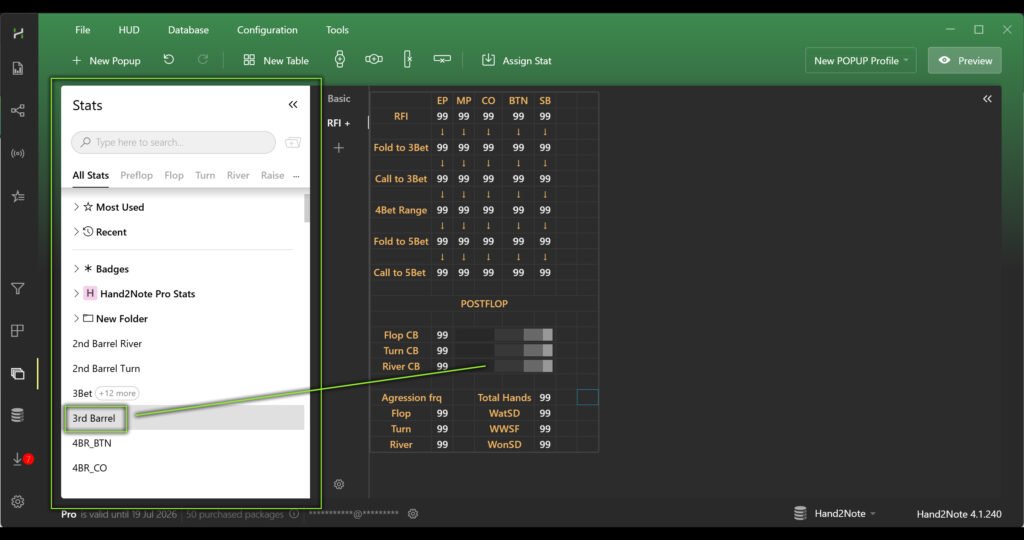
To add a stat to a histogram, open the “Stats” navigation menu on the left side of the window, find the desired stat, and drag it directly onto the histogram.
Creating inner tabs and adding preflop diagrams
Now let’s look at how to add inner tabs and place preflop diagrams inside them for the required stats.
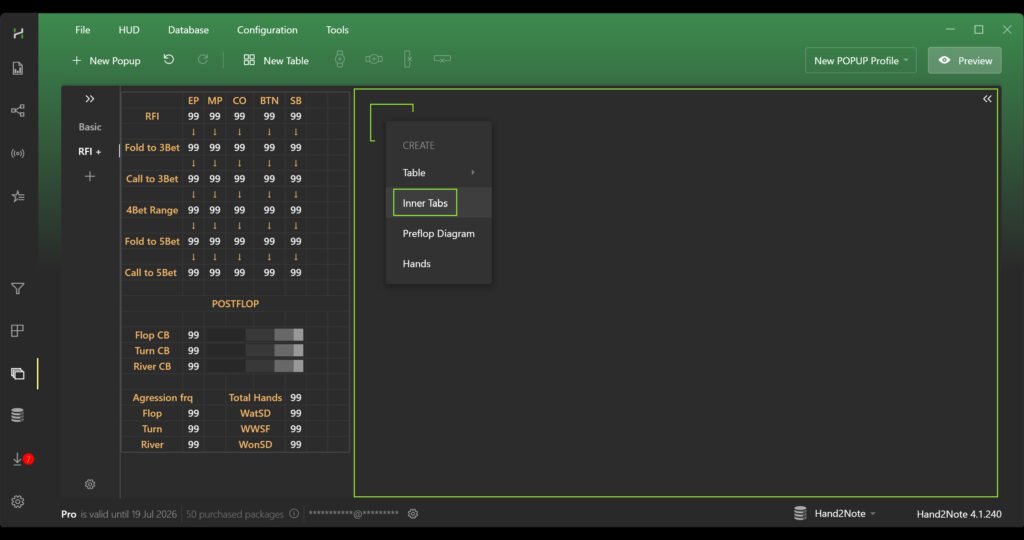
Right-click on an empty area in the popup workspace and select “Inner Tabs” — this will add an empty panel with inner tabs.
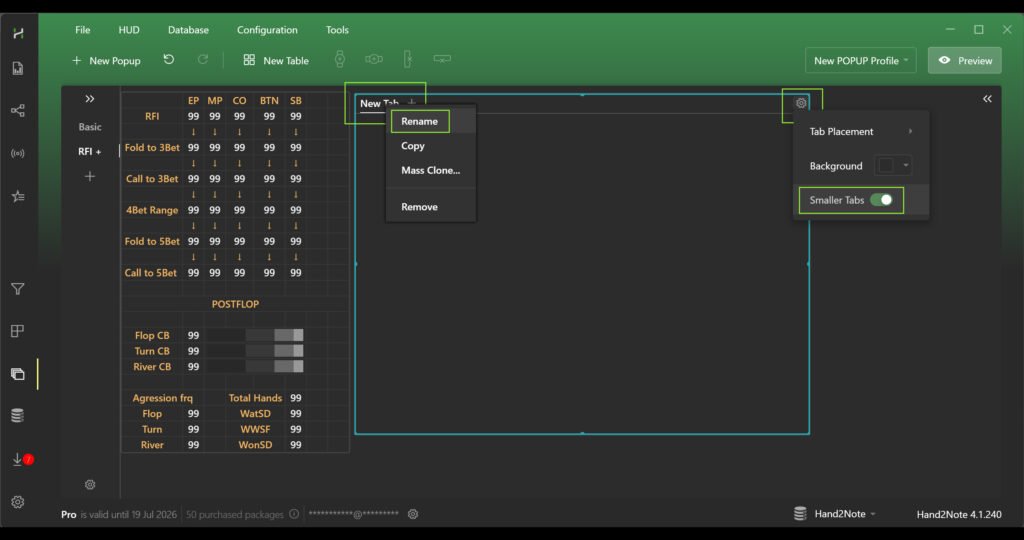
Next, adjust the appearance: to make the tabs more compact, click the gear icon in the top-right corner and enable the “Smaller Tabs” toggle. Then create the required number of tabs and rename them — click on the tab name and select “Rename”, then assign a convenient name. Repeat these steps for each tab, for example: “RFI EP”, “RFI MP”, “RFI CO”, “RFI BTN”, “RFI SB”.
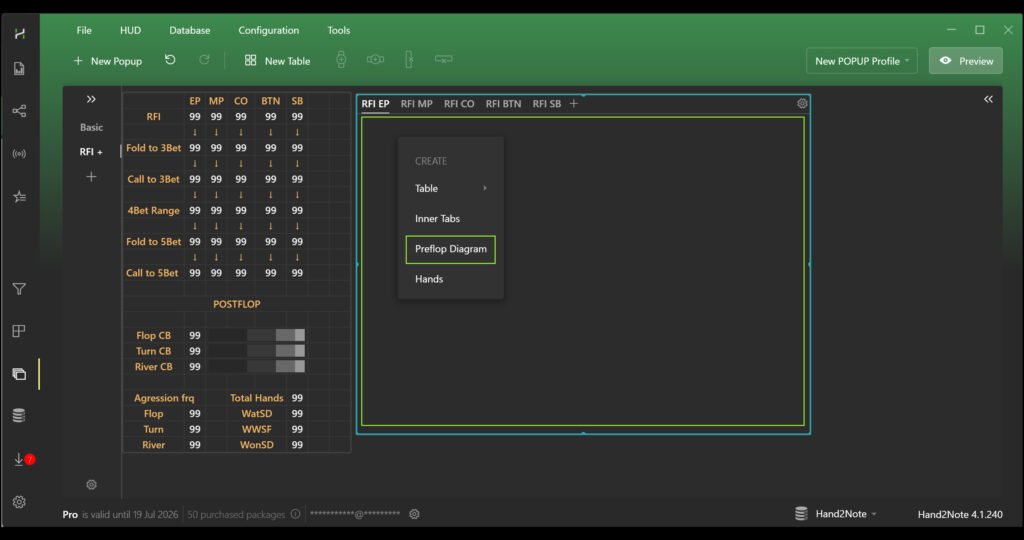
Now you need to add a preflop diagram to each of the created inner tabs. To do this, right-click on an empty space inside the desired tab and select “Preflop Diagram”.
Next, you need to assign the stat that each diagram will display.
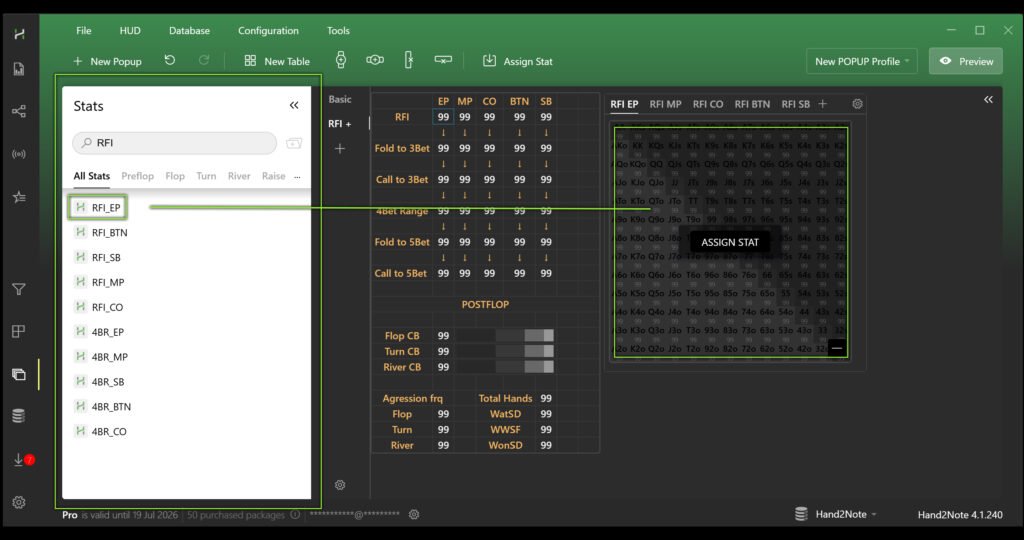
To add a stat to a diagram, open the “Stats” navigation menu on the left side of the window, find the desired stat, and drag it directly onto the diagram.
In the same way, create tabs and add preflop diagrams for each stat you want to display. After that, the creation of a complex professional popup can be considered complete.
Conclusion
To sum up, creating a complex popup is a process made up of several logical steps that you have now mastered.
First, the interface was enhanced with visual postflop histograms showing continuation bet frequencies, and then a system of inner tabs was organized. Thanks to these tabs, multiple preflop diagrams could be displayed at once and neatly structured. The result is a compact yet powerful tool: instead of scattered numbers, you now have visual representations of ranges and key aggressive actions, making analysis faster and more accurate.
Latest guides
-
 Exploit Basics: Passive Player Profile Apr 9, 2026
 -
 Hand2Note Popup Editor: Creating a Professional Popup Mar 28, 2026
 -
 Hand2Note Pro Pricing Reduced in 2026 Mar 19, 2026
 -
 How to Analyze Fish Ranges: Limp, Limp-Raise, and Limp-Fold Mar 13, 2026
 -
 Hand2Note Popup Editor: Creating a Simple Popup Mar 10, 2026
We regularly publish new Hand2Note 4 guides on our Discord server.
Join Discord Server